
What Those Three Linux “CPU Usage” Numbers Mean
Just a quick note to self (and anyone looking for the same information). A common question I get for my free WordPress plugin, Dashboard Widgets Suite (DWS), is “what do the CPU Usage” numbers mean? Users get curious because the DWS plugin displays something like this on the WordPress Dashboard:
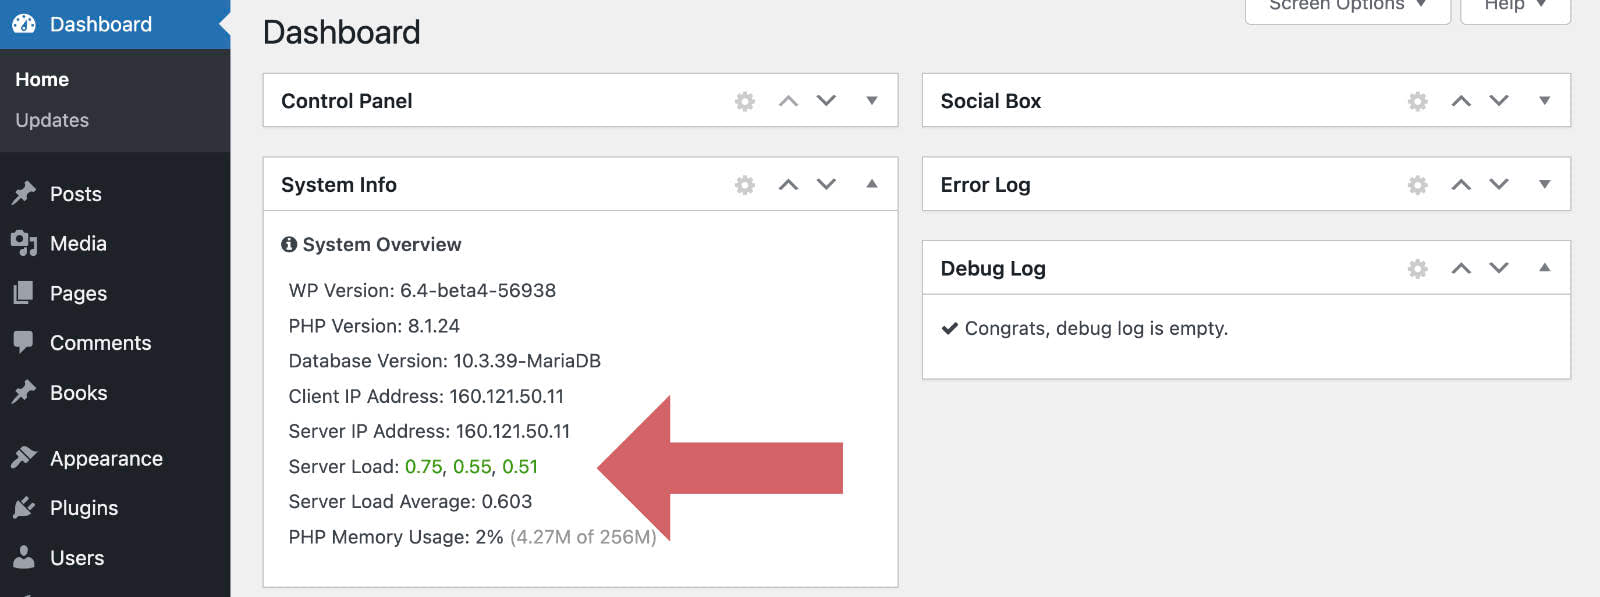 Displaying CPU Usage and other stats on the WP Dashboard (click image for full-size view)
Notice in the screenshot, where it shows the three numbers for “CPU Usage”:
0.75, 0.55, 0.51As explained in more detail elsewhere, those three numbers are referred to as Load Average. They are a measure of the load (resource usage) on the CPU. The numbers are based on the number of cores used by your Linux server. Exactly how the three numbers are calculated is all a bit esoteric, proprietary, and “mathy”, so let’s look at a few concrete examples to get a better idea of how it works..
One core:
0.50, 0.50, 0.50 = server using 50% of CPU
1.00, 1.00, 1.00 = server using 100% of CPU
2.00, 2.00, 2.00 = server using 200% of CPU

Two cores:
0.50, 0.50, 0.50 = server using 25% of CPU
1.00, 1.00, 1.00 = server using 50% of CPU
2.00, 2.00, 2.00 = server using 100% of CPU

Three cores:
0.50, 0.50, 0.50 = server using 16.6% of CPU
1.00, 1.00, 1.00 = server using 33.3% of CPU
2.00, 2.00, 2.00 = server using 66.6% of CPU

Four cores:
0.50, 0.50, 0.50 = server using 12.5% of CPU
1.00, 1.00, 1.00 = server using 25% of CPU
2.00, 2.00, 2.00 = server using 50% of CPU
Those are idealized numbers to make things simpler to understand. In practice, the three numbers will vary, possibly quite a bit. In the examples above, notice how the usage percentages (e.g., 50%, 100%, 200%) decrease as the number of cores increase. Which makes sense because more cores typically means more resources, and thus lighter loads.
Math formula
To understand the front-end math for the three numbers, consider the simplest case:
One core:
1.00, 1.00, 1.00 = server using 100% of CPU
Makes sense. Now add another core and the load is split in half, and thus the CPU usage is decreased to 50%, like so:
Two cores:
1.00, 1.00, 1.00 = server using 50% of CPU
And so forth. In general, here is the mathematical formula calculate the percentage of CPU usage based on load average and the number of cores:
(load average × 100) / (number of cores) = % CPU usageSo returning to the opening example averages:
0.75, 0.55, 0.51..we can calculate the percent CPU usage on the server for each of the three numbers:
Two cores:
(0.75 × 100) / 2 = 37.5% CPU usage
(0.55 × 100) / 2 = 27.5% CPU usage
(0.51 × 100) / 2 = 25.5% CPU usage
..which (for me at least) is a comfortable running load average for the server.
Fifteen minutes
Another thing to understand is that the three numbers represent the load average over the past 15 minutes. The first number represents 1 minute ago. The second number 5 minutes ago, and the third number 15 minutes ago. To illustrate:
1 minute, 5 minutes, 15 minutes
0.75,     0.55,      0.51
In general, lower numbers are better. For example, on a 1-core server, once the numbers approach 1.00, it means the server is processing at 100% capacity. Likewise as the numbers go higher than 1.00, it means the CPU is running at maximum capacity and there are tasks waiting to run as soon as other tasks finish.
Healthy numbers
So what do “healthy” load averages look like? Really it depends entirely on the server and how it’s set up and configured. In general you want lower numbers.
For example, the three numbers above (0.75, 0.55, 0.51) are typical of averages on my own server, which get fairly heavy traffic. In other cases, I’ve watched servers operate near or over 100% capacity for weeks or more. It really depends on a lot of factors. Just basically keep an eye on it and ask your web host if you have any questions or concerns.
For a deeper dive into the fun world of server performance, check out the related article, Understanding CPU Utilization, plus tons more stuff online to surf around.


2 responses to “What Those Three Linux “CPU Usage” Numbers Mean”
Like the article, but I’m not sure the “Fifteen minutes” section is completely correct.
It’s my understanding that the first number is the average over the last minute, the second over the last 5 minutes, and the last one is the load average over the last 15 minutes. So not “15 minutes ago”, but between then and now.
This also explains why the first umber will usually fluctuate more erratically.
Good info, thank you for sharing Roy.